示例
精选教程
PyOD 凭借一些精选文章和教程,在机器学习社区获得了广泛认可。
Analytics Vidhya: 使用 PyOD 库在 Python 中学习离群点检测的绝佳教程
KDnuggets: 离群点检测方法的直观可视化
Towards Data Science: 异常检测傻瓜指南
awesome-machine-learning: 通用机器学习
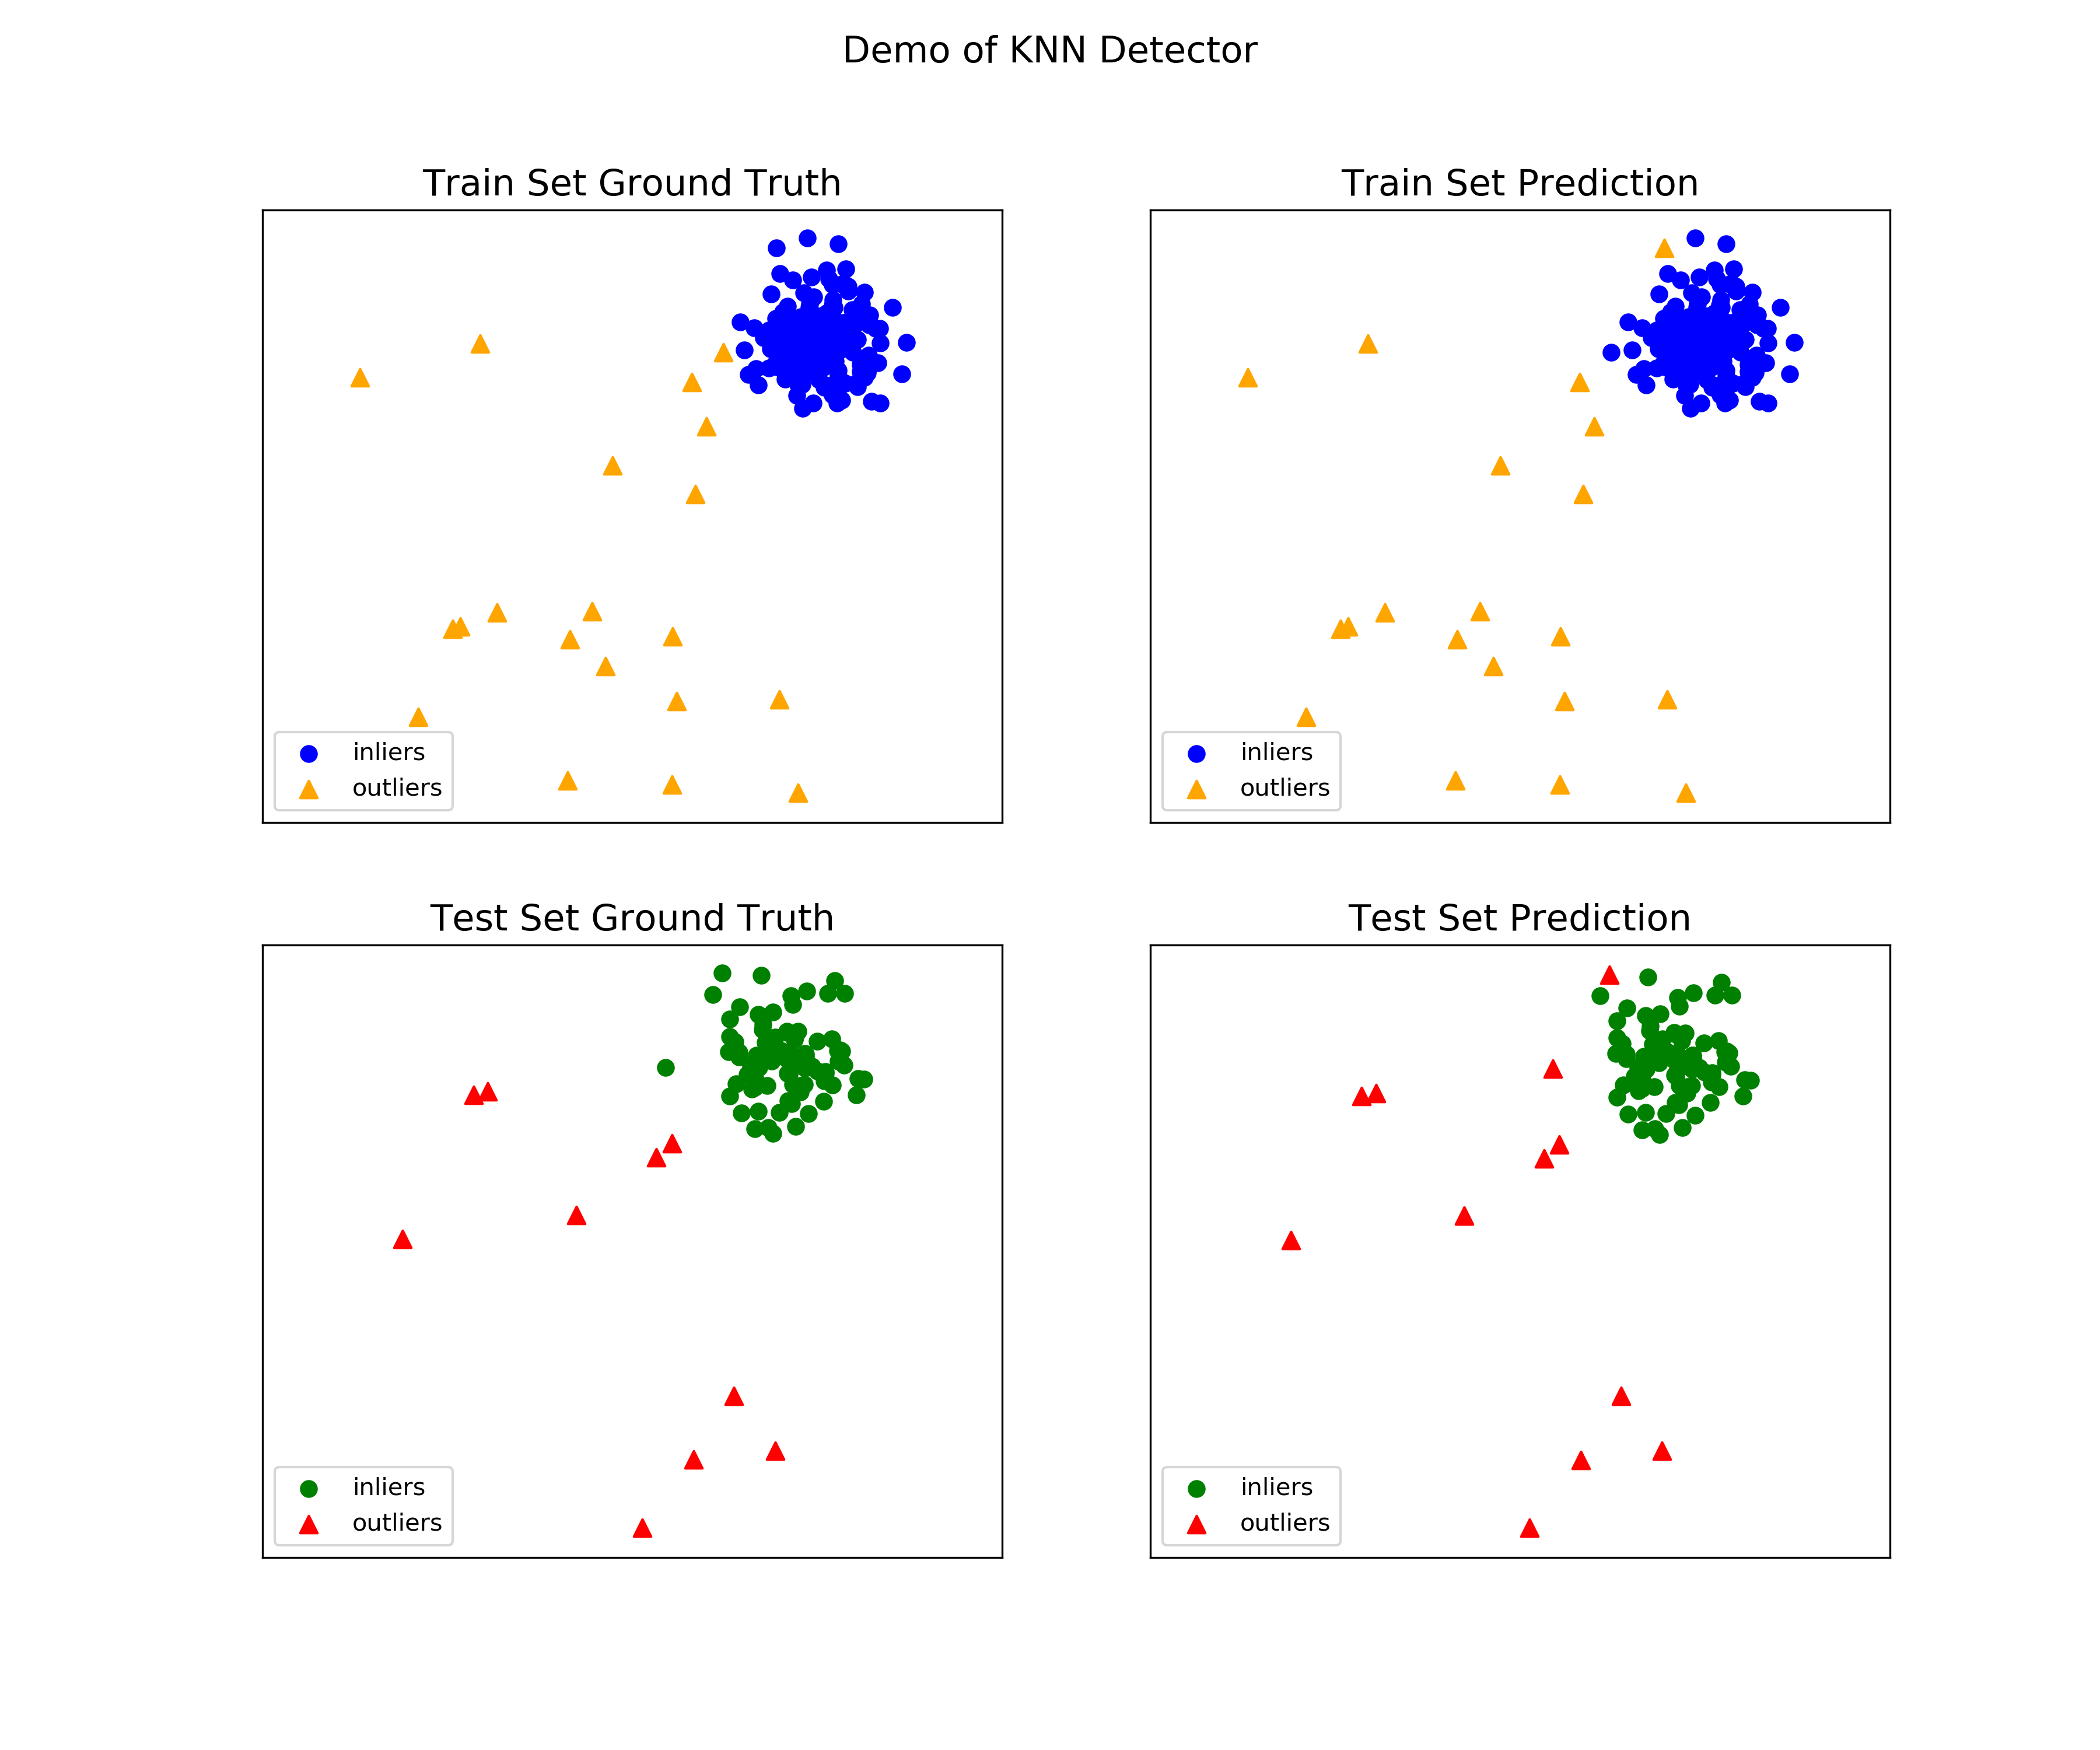
kNN 示例
完整示例:knn_example.py
导入模型
from pyod.models.knn import KNN # kNN detector
使用
pyod.utils.data.generate_data()生成样本数据contamination = 0.1 # percentage of outliers n_train = 200 # number of training points n_test = 100 # number of testing points X_train, X_test, y_train, y_test = generate_data( n_train=n_train, n_test=n_test, contamination=contamination)
初始化一个
pyod.models.knn.KNN检测器,拟合模型,并进行预测。# train kNN detector clf_name = 'KNN' clf = KNN() clf.fit(X_train) # get the prediction labels and outlier scores of the training data y_train_pred = clf.labels_ # binary labels (0: inliers, 1: outliers) y_train_scores = clf.decision_scores_ # raw outlier scores # get the prediction on the test data y_test_pred = clf.predict(X_test) # outlier labels (0 or 1) y_test_scores = clf.decision_function(X_test) # outlier scores # it is possible to get the prediction confidence as well y_test_pred, y_test_pred_confidence = clf.predict(X_test, return_confidence=True) # outlier labels (0 or 1) and confidence in the range of [0,1]
使用 ROC 和 Precision @ Rank n
pyod.utils.data.evaluate_print()评估预测结果。from pyod.utils.data import evaluate_print # evaluate and print the results print("\nOn Training Data:") evaluate_print(clf_name, y_train, y_train_scores) print("\nOn Test Data:") evaluate_print(clf_name, y_test, y_test_scores)
查看训练数据和测试数据上的样本输出。
On Training Data:
KNN ROC:1.0, precision @ rank n:1.0

On Test Data:
KNN ROC:0.9989, precision @ rank n:0.9
通过所有示例中包含的可视化函数生成可视化结果。
visualize(clf_name, X_train, y_train, X_test, y_test, y_train_pred,
          y_test_pred, show_figure=True, save_figure=False)
模型组合示例
离群点检测由于其无监督特性,经常受到模型不稳定性的困扰。因此,建议结合各种检测器的输出(例如通过平均)来提高其鲁棒性。检测器组合是离群点集成方法的一个子领域;更多信息请参考 [BKalayciE18]。
本演示中展示了四种分数组合机制
平均:所有检测器的分数平均值。
最大化:所有检测器的最高分。
最大值平均 (AOM):将基础检测器分为子组,并取每个子组的最高分。最终分数是所有子组分数的平均值。
平均值最大 (MOA):将基础检测器分为子组,并取每个子组的平均分。最终分数是所有子组分数的最大值。
“examples/comb_example.py” 演示了组合多个基础检测器输出的 API(comb_example.py,Jupyter Notebooks)。对于 Jupyter Notebooks,请导航至 “/notebooks/Model Combination.ipynb”
导入模型并生成样本数据。
from pyod.models.knn import KNN  # kNN detector
from pyod.models.combination import aom, moa, average, maximization
from pyod.utils.data import generate_data

X, y= generate_data(train_only=True)  # load data
初始化 20 个不同 k 值(10 到 200)的 kNN 离群点检测器,并获取离群点分数。
# initialize 20 base detectors for combination
k_list = [10, 20, 30, 40, 50, 60, 70, 80, 90, 100, 110, 120, 130, 140,
            150, 160, 170, 180, 190, 200]
n_clf = len(k_list) # Number of classifiers being trained

train_scores = np.zeros([X_train.shape[0], n_clf])
test_scores = np.zeros([X_test.shape[0], n_clf])

for i in range(n_clf):
    k = k_list[i]

    clf = KNN(n_neighbors=k, method='largest')
    clf.fit(X_train_norm)

    train_scores[:, i] = clf.decision_scores_
    test_scores[:, i] = clf.decision_function(X_test_norm)
然后将输出分数在组合前标准化为零均值和单位标准差。这一步对于将检测器输出调整到同一尺度至关重要。
from pyod.utils.utility import standardizer

# scores have to be normalized before combination
train_scores_norm, test_scores_norm = standardizer(train_scores, test_scores)
如上所述,应用了四种不同的组合算法
comb_by_average = average(test_scores_norm)
comb_by_maximization = maximization(test_scores_norm)
comb_by_aom = aom(test_scores_norm, 5) # 5 groups
comb_by_moa = moa(test_scores_norm, 5) # 5 groups
最后,使用 ROC 和 Precision @ Rank n 评估了所有四种组合方法
Combining 20 kNN detectors
Combination by Average ROC:0.9194, precision @ rank n:0.4531
Combination by Maximization ROC:0.9198, precision @ rank n:0.4688
Combination by AOM ROC:0.9257, precision @ rank n:0.4844
Combination by MOA ROC:0.9263, precision @ rank n:0.4688
阈值示例
完整示例:threshold_example.py
导入模型
from pyod.models.knn import KNN   # kNN detector
from pyod.models.thresholds import FILTER  # Filter thresholder
使用
pyod.utils.data.generate_data()生成样本数据contamination = 0.1 # percentage of outliers n_train = 200 # number of training points n_test = 100 # number of testing points X_train, X_test, y_train, y_test = generate_data( n_train=n_train, n_test=n_test, contamination=contamination)
初始化一个
pyod.models.knn.KNN检测器,拟合模型,并进行预测。# train kNN detector and apply FILTER thresholding clf_name = 'KNN' clf = KNN(contamination=FILTER()) clf.fit(X_train) # get the prediction labels and outlier scores of the training data y_train_pred = clf.labels_ # binary labels (0: inliers, 1: outliers) y_train_scores = clf.decision_scores_ # raw outlier scores
参考文献
İlker Kalaycı and Tuncay Ercan. 使用基于直方图的离群点评分方法对无线传感器网络数据进行异常检测。载于 2018 2nd International Symposium on Multidisciplinary Studies and Innovative Technologies (ISMSIT), 1–6. IEEE, 2018.